Built for the Entire Data Lifecycle
From raw data ingestion to stakeholder reporting — ATD covers every layer of your data estate with tools designed by and for Data Specialists.
Start Free TrialData Feeds
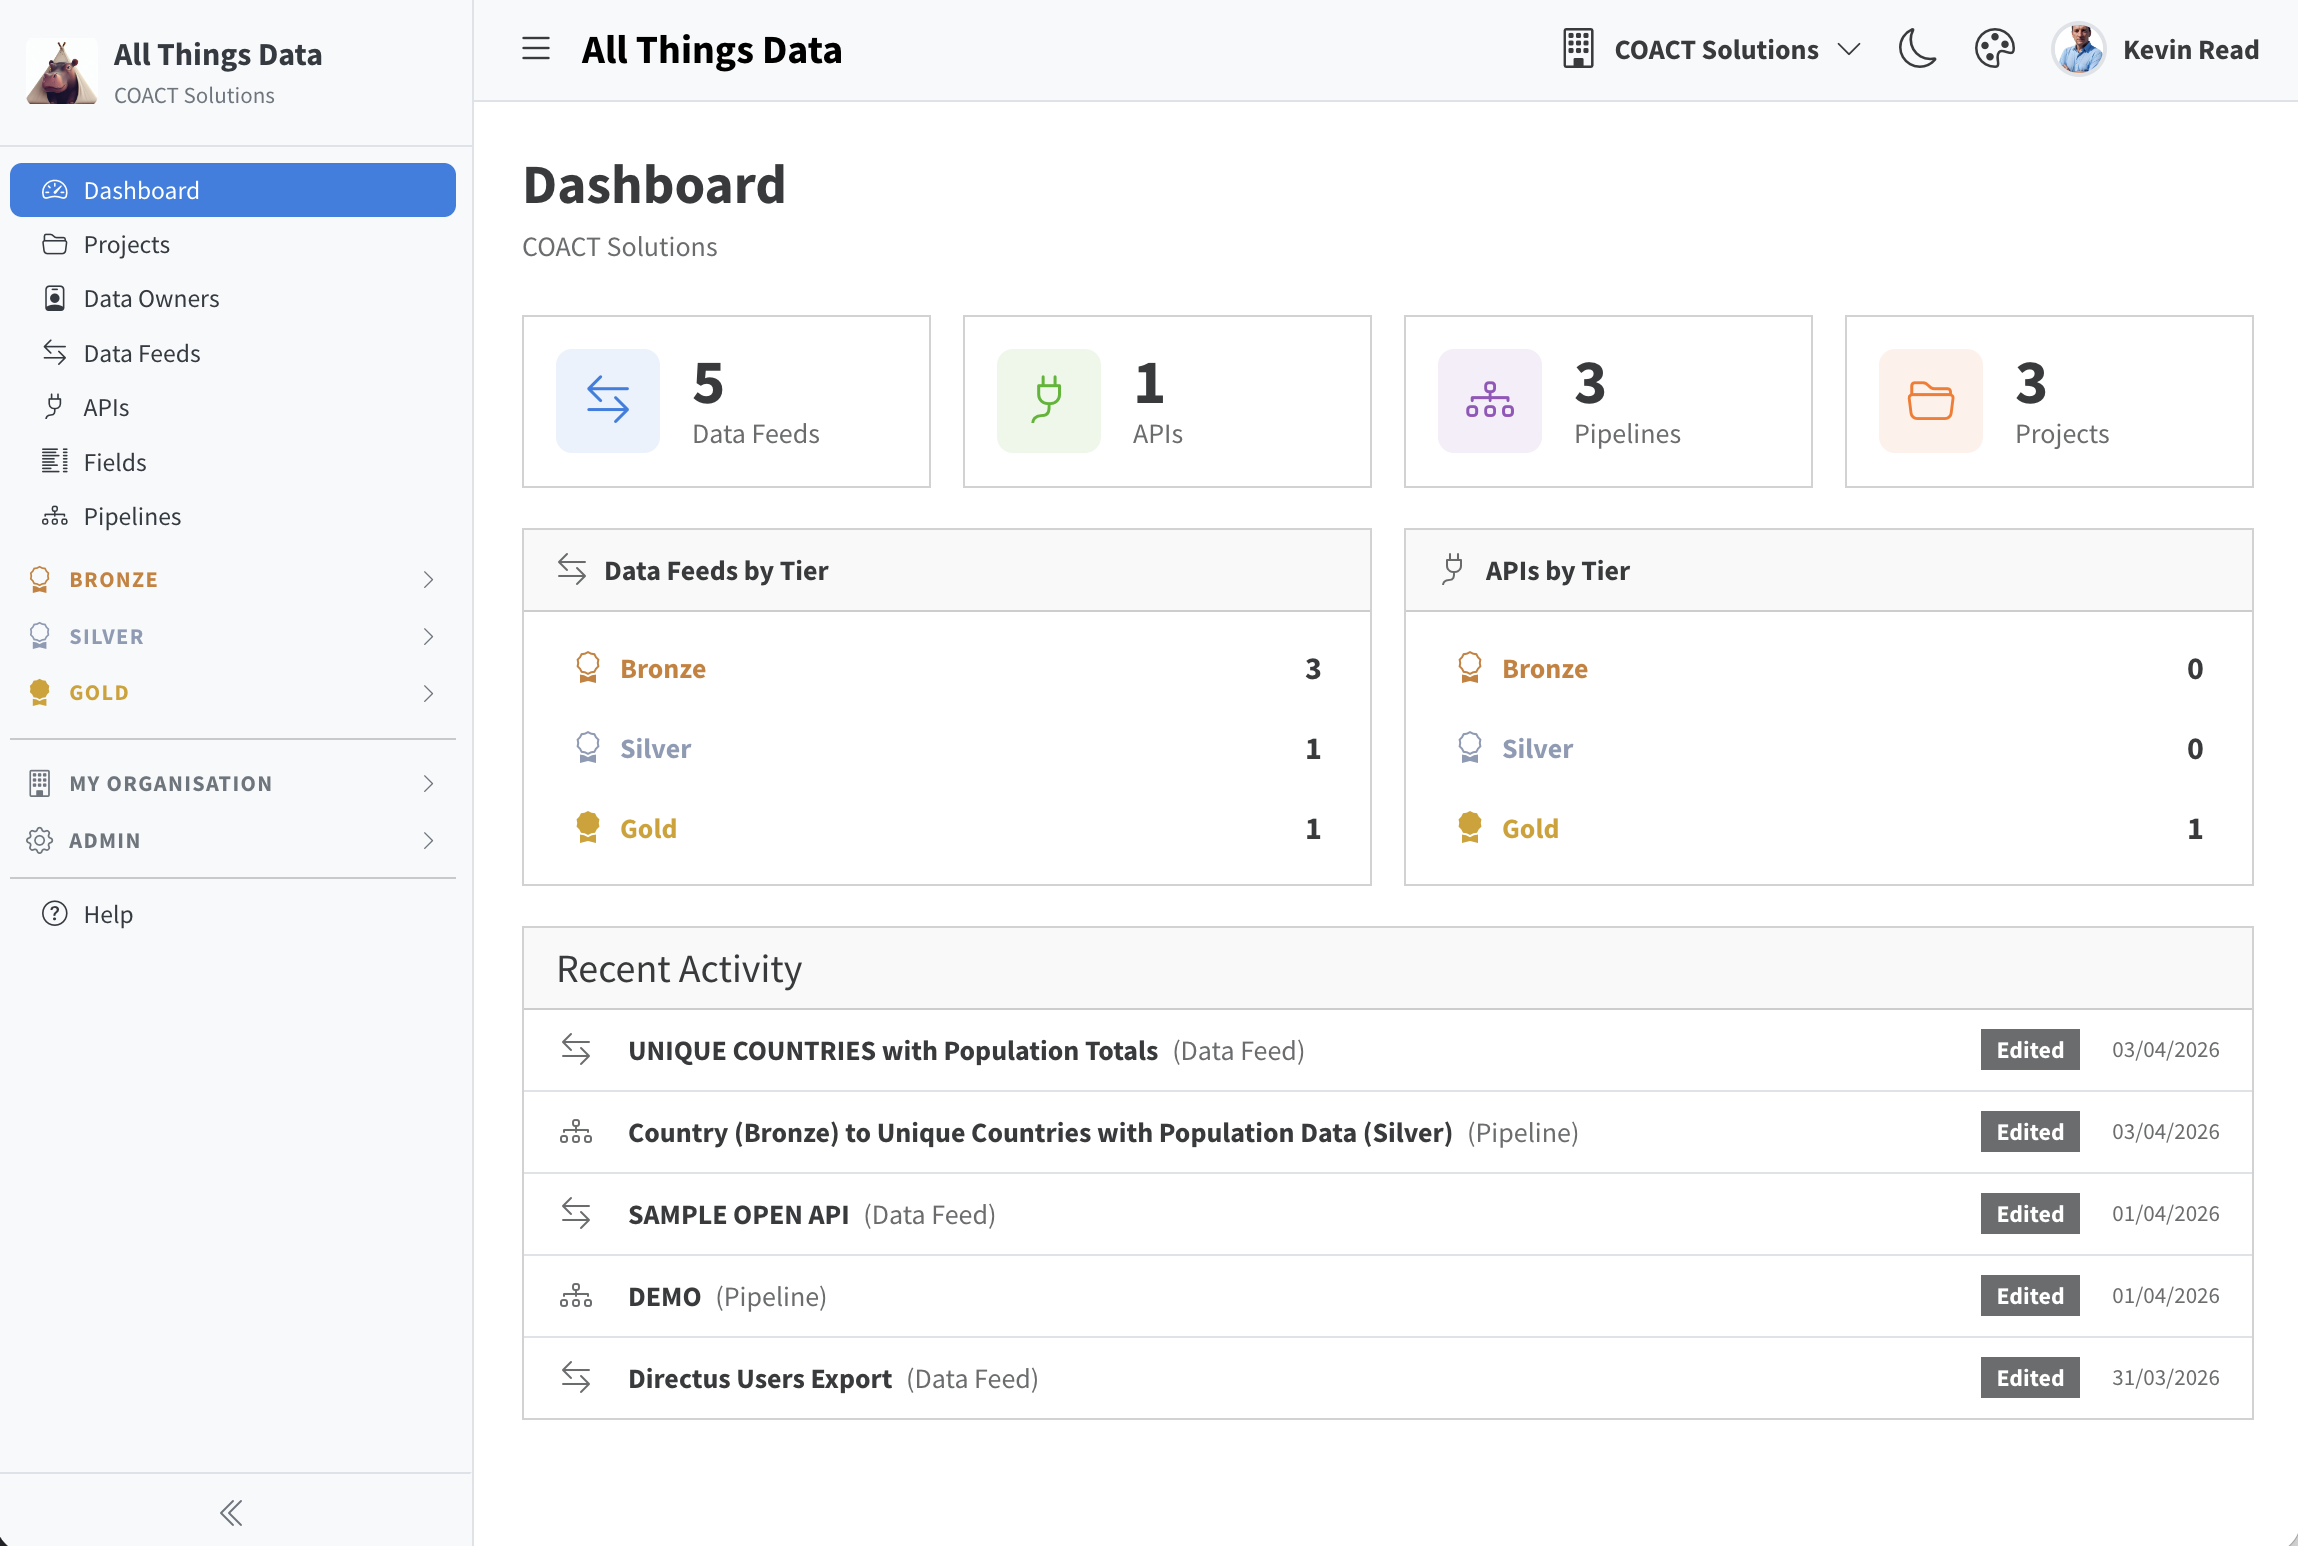
Data Feeds are the foundation of your catalog — every raw source that flows into your organisation. ATD lets you document source systems, formats, frequencies, and medallion tier classification in one place, so your team always knows what data they have and where it lands.
- Track source system, format type (CSV, JSON, Parquet, etc.), and delivery frequency
- Assign Bronze/Silver/Gold medallion tier to every feed
- Link feeds directly to Pipelines and Projects
- Tag feeds for fast discovery across the catalog
- Full change history — know when a feed definition last changed and who changed it
APIs
APIs are often the invisible infrastructure of a data estate. ATD gives every API a home — version tracking, base URL, endpoints, and associated queries — so Data Architects and Engineers have a single place to understand the API landscape.
Pipelines
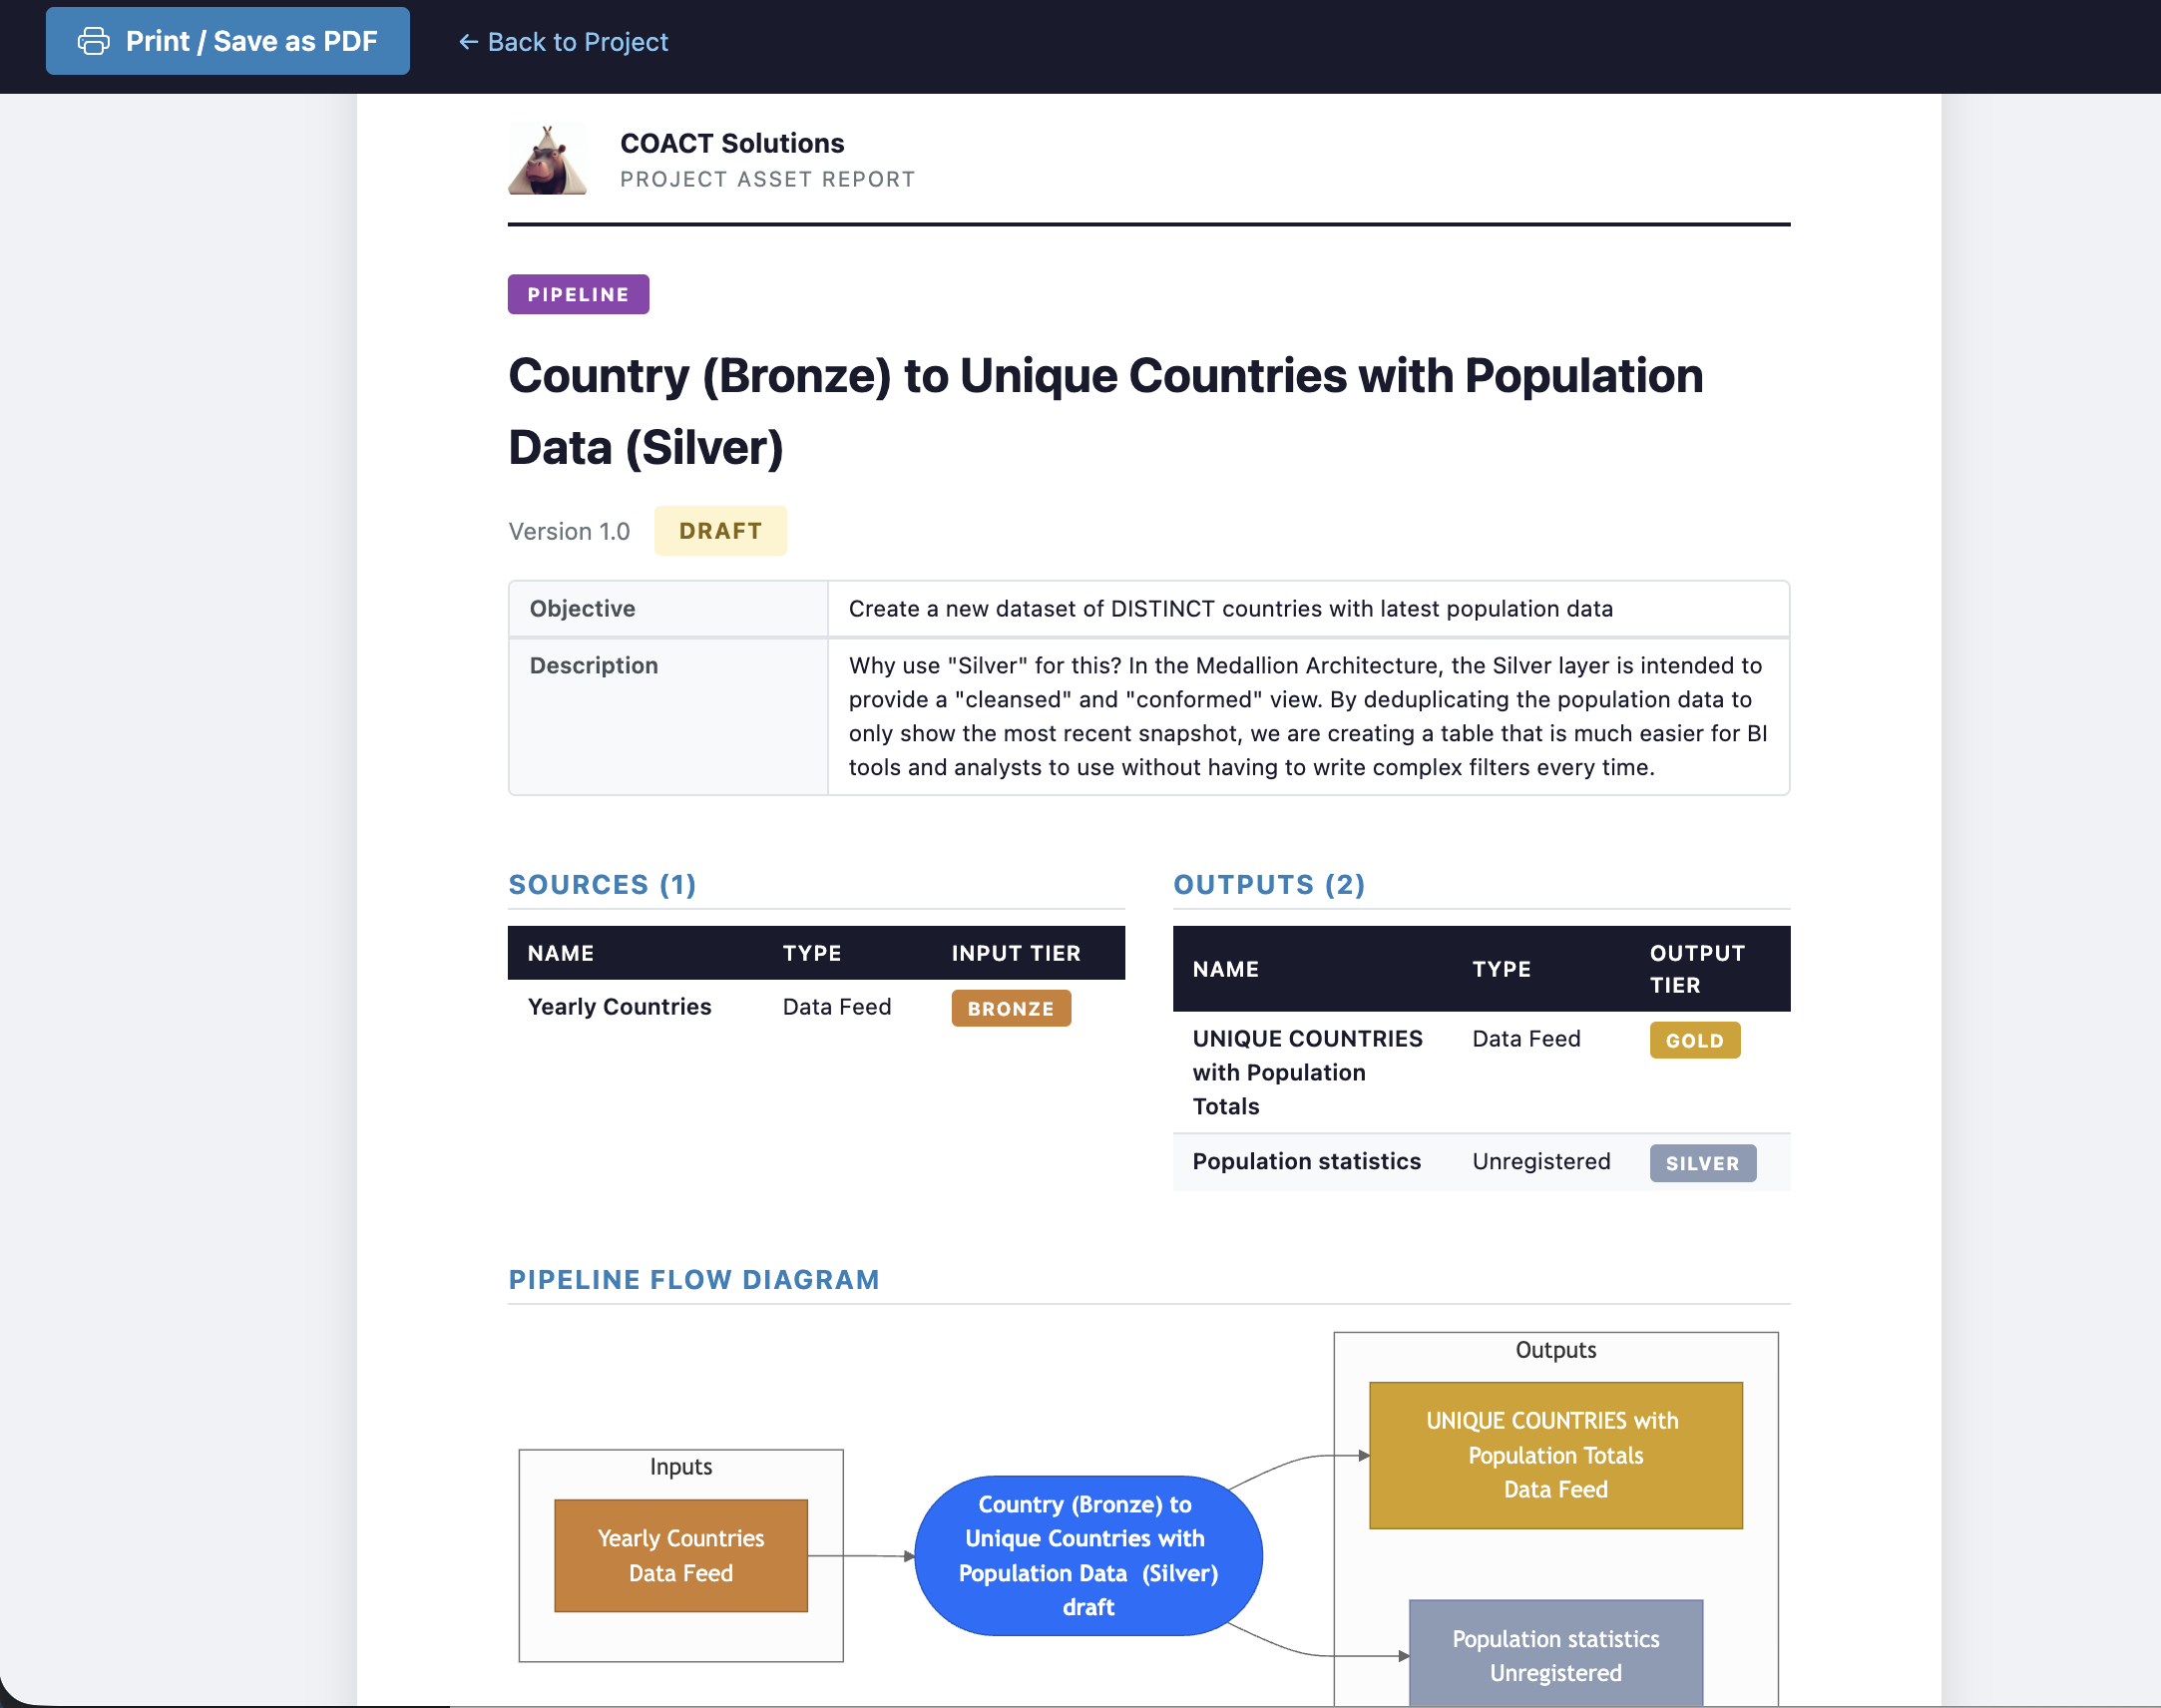
Pipelines are the transformation layer between raw ingestion and business consumption. ATD models each pipeline with its source inputs, output datasets, version history, and a visual flow diagram — so anyone on the team can understand what a pipeline does at a glance.
- Define pipeline sources (feeds or other assets) and outputs (feeds, APIs, or unregistered)
- Automatic flow diagram generation showing source → transform → output
- Version tracking with status (Draft, Active, Deprecated)
- Attach transformation logic with syntax-highlighted code display
- Bronze → Silver → Gold tier progression tracked at the pipeline level
Projects
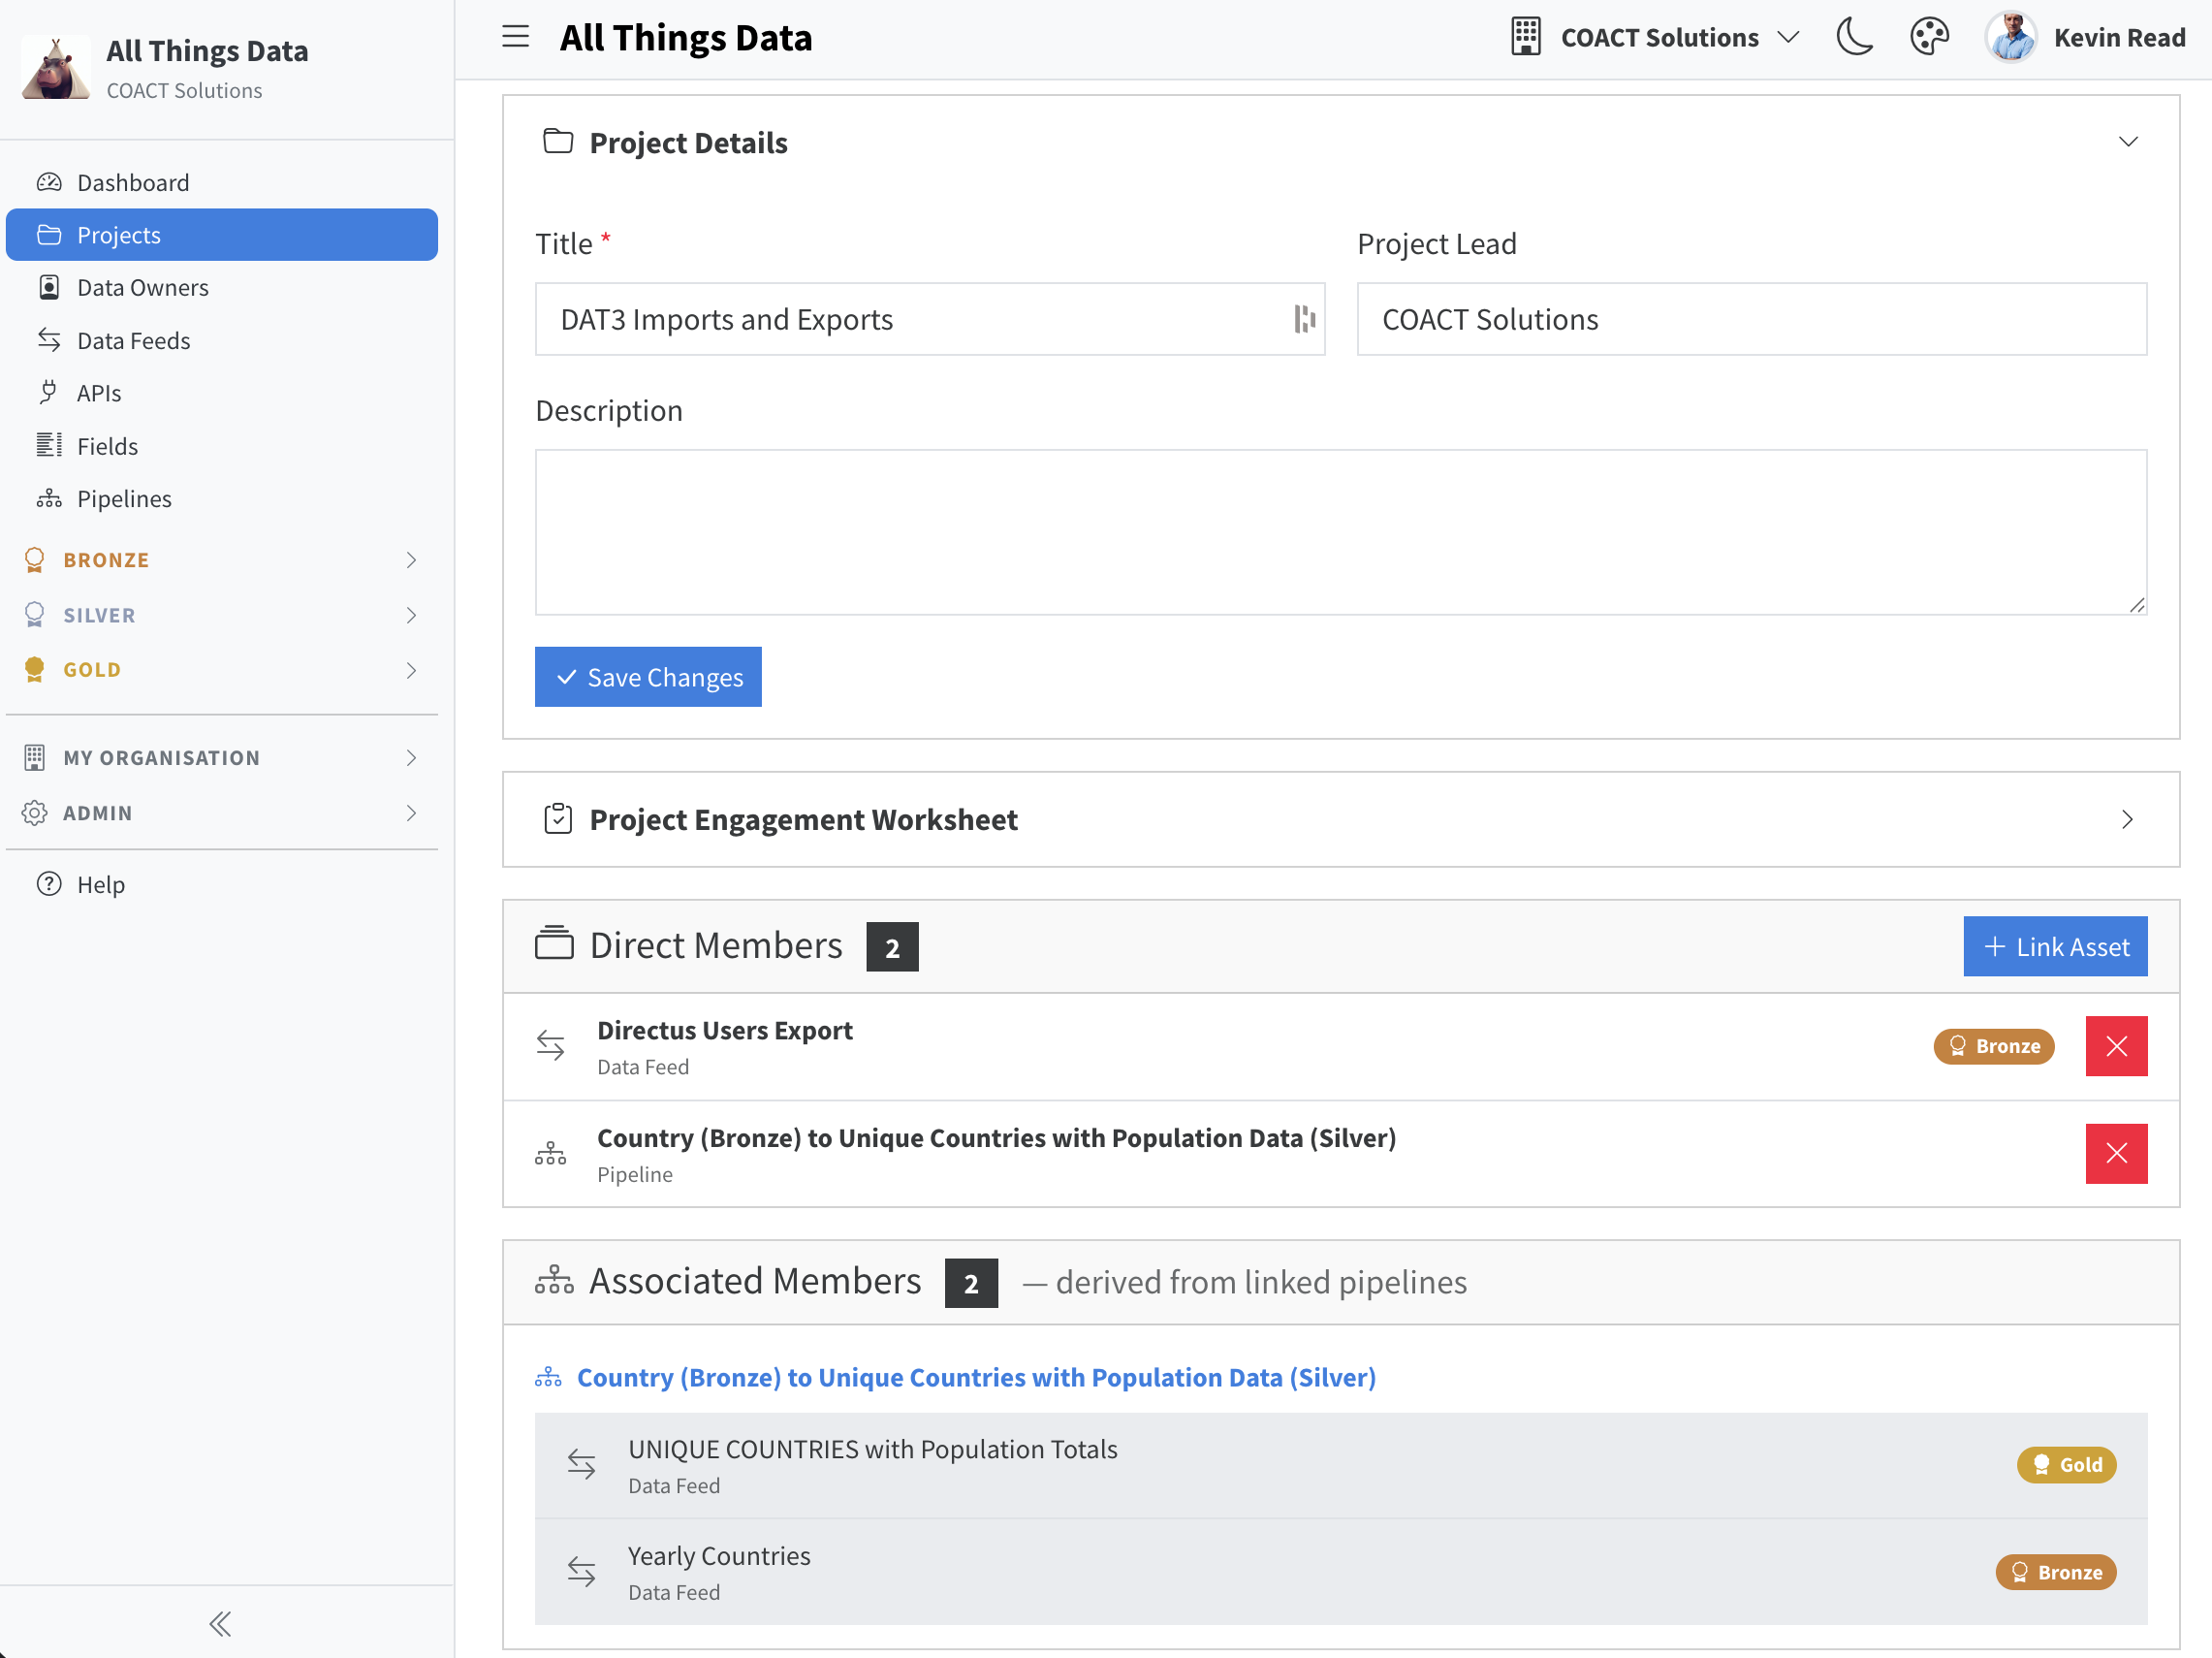
Data initiatives rarely exist in isolation. ATD Projects let you group related feeds, APIs, and pipelines into a business context — complete with a stakeholder engagement worksheet, project lead assignment, and a printable PDF report for governance meetings.
- Group any combination of Feeds, APIs, and Pipelines into a project
- Assign a project lead for accountability
- Interactive engagement worksheet covering objectives, timeline, and app dependencies
- Asset count and tier summary at a glance
- One-click PDF export — stakeholder-ready reports without any formatting work
Data Owners
Data quality issues go unresolved when no one knows who is responsible. ATD's Data Owners module lets you register individuals or teams as accountable owners, then link them to specific feeds, APIs, or pipelines. Governance is proactive, not reactive.
Data Dictionary
Every Data Feed and API Query gets its own dedicated dictionary. Go beyond field names and types — capture business context, governance classifications, and derivation logic that turns a schema into living documentation your whole organisation can trust and act on.
Medallion Architecture
ATD is built around the Medallion Architecture pattern — Bronze (raw ingestion), Silver (cleansed and conformed), Gold (business-ready). Every asset is classified and displayed with its tier, giving your team a shared vocabulary and governance framework without any custom setup.
PDF Reports
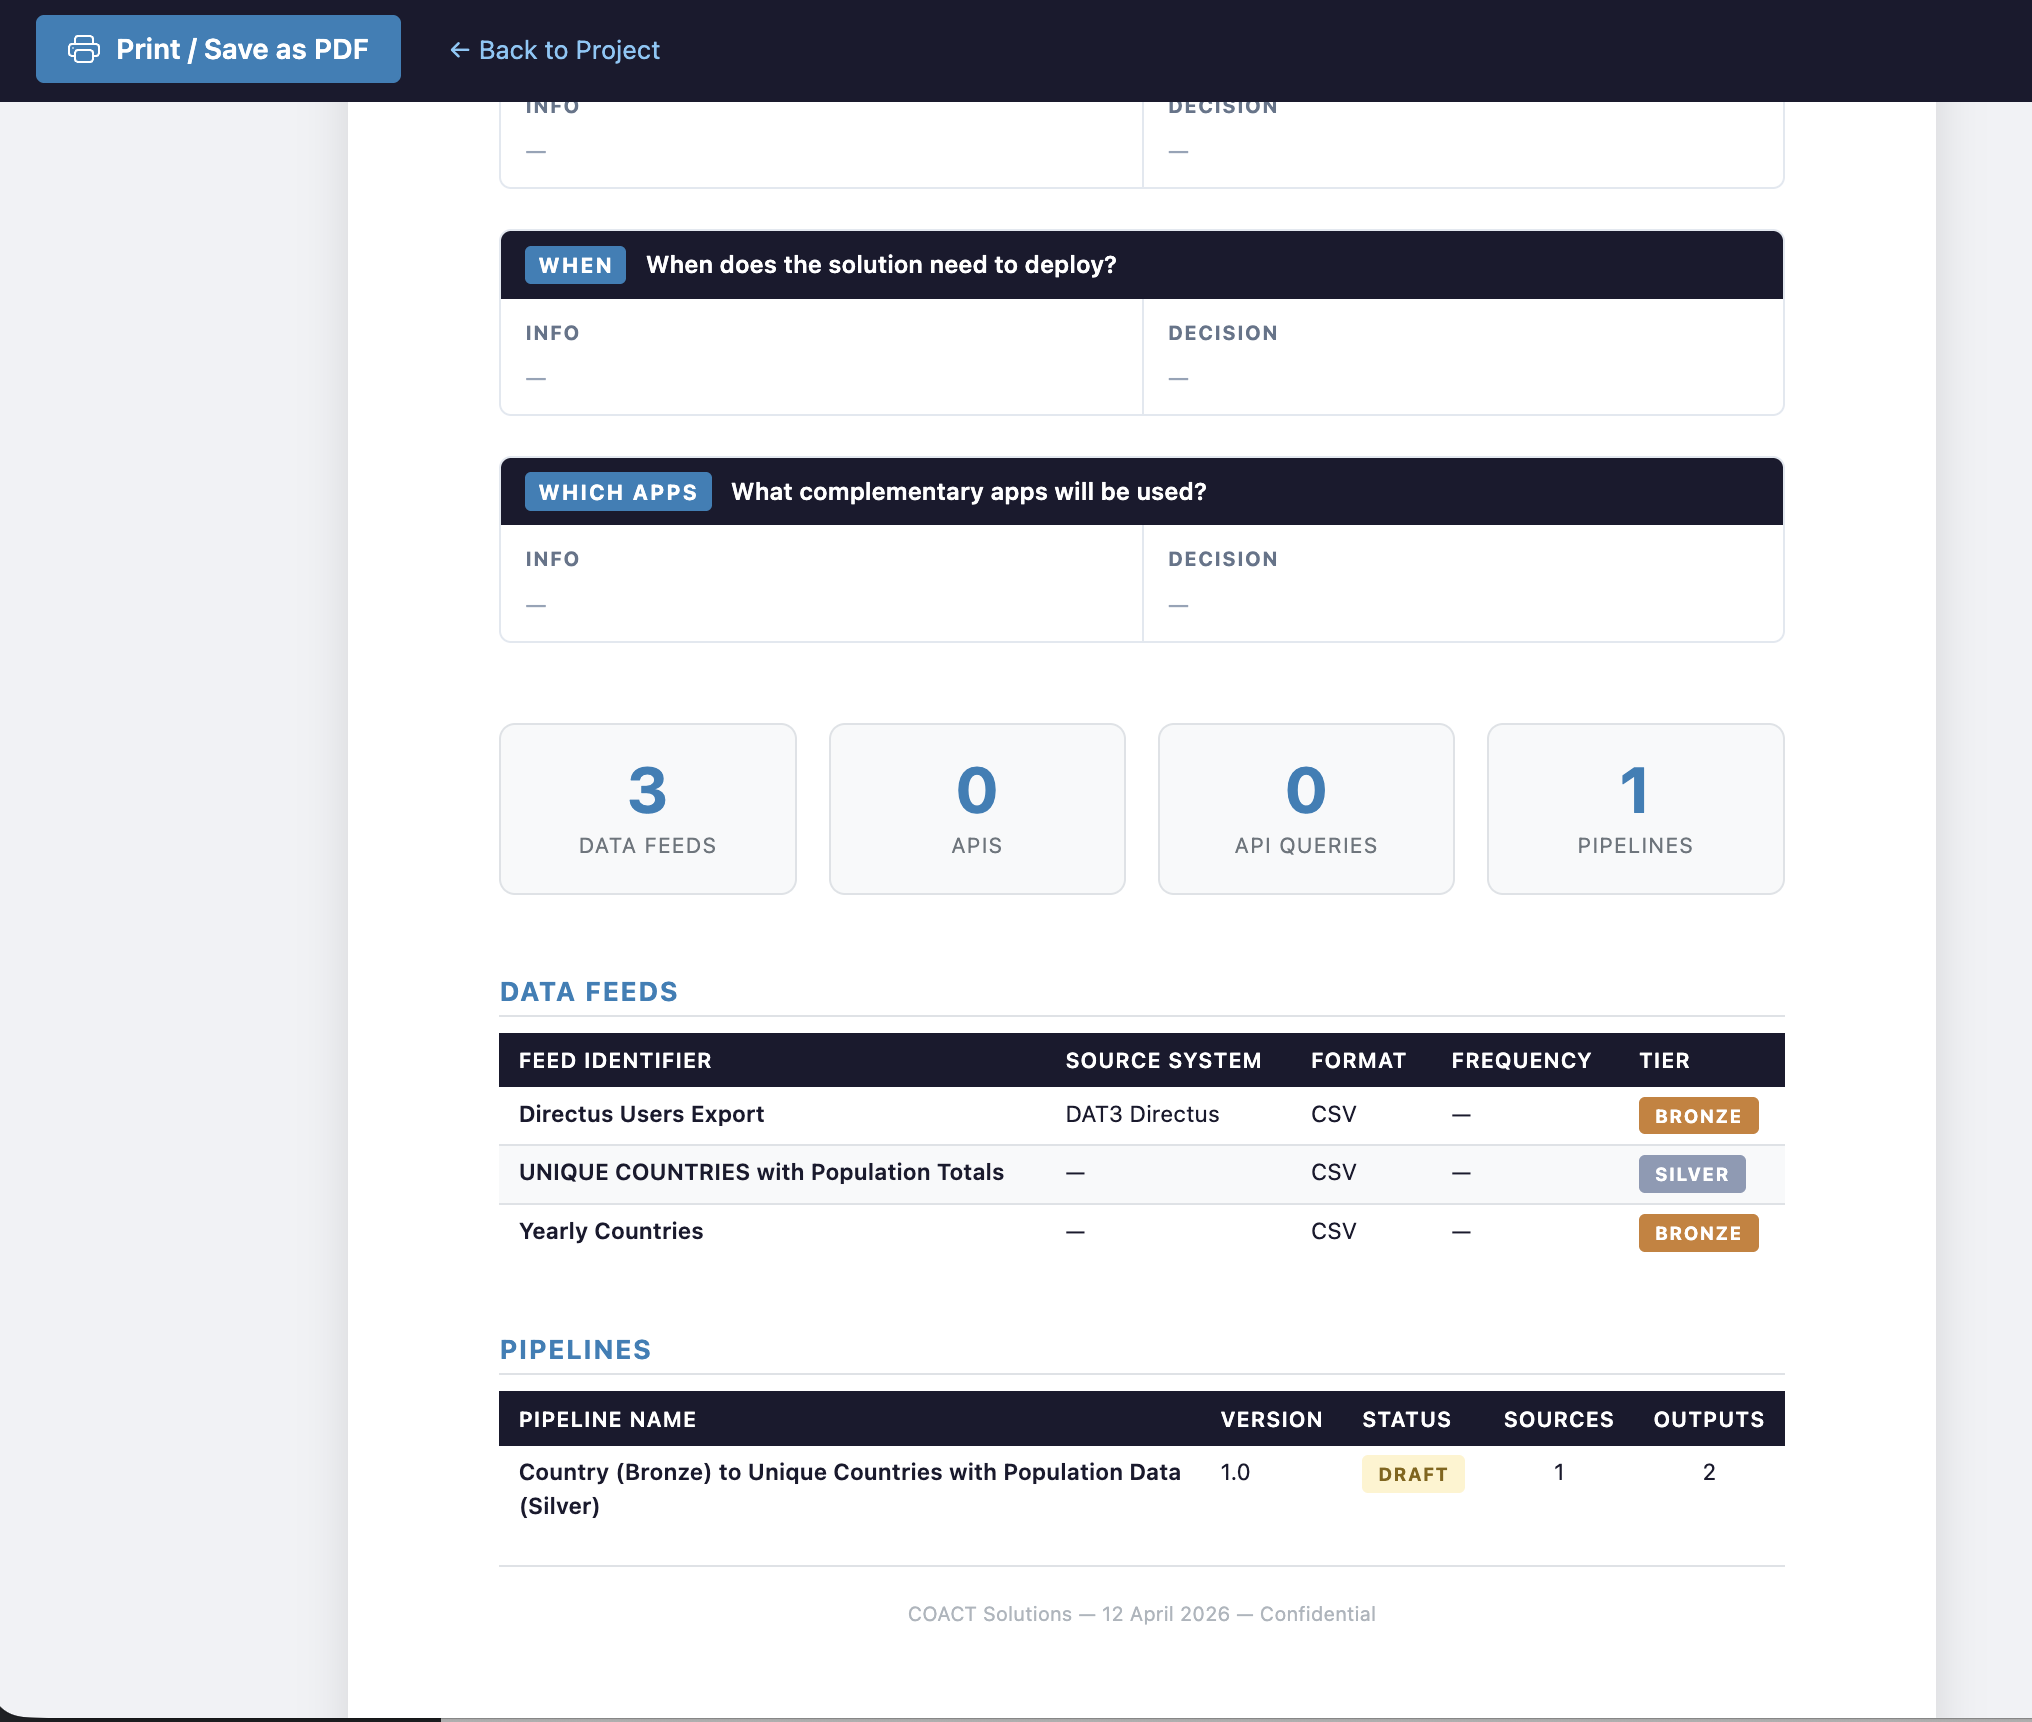
Every asset in ATD can be exported as a professional PDF report — complete with metadata, linked assets, ownership information, and engagement worksheets. No copy-pasting into PowerPoint. No manual formatting. Just click print.
- Project Engagement Worksheets exported as structured PDF documents
- Individual asset reports for Data Feeds, APIs, Pipelines
- Organisation branding and CONFIDENTIAL watermark included
- Asset counts, tier breakdown, and member lists included automatically
- Print directly from the browser or save as PDF
Task Management
ATD's Task Management gives data teams a single place to capture, prioritise, and track work — whether it's a personal to-do or a critical fix linked to a specific pipeline. A Kanban board and tristate status keep the whole team aligned without leaving the catalog.
Meeting Notes
Stop losing decisions and action items in email threads. ATD's Meeting Notes module gives every meeting a structured home — with split to-do columns for team and stakeholder actions, auto-save as you type, and direct integration with the task management system.
Documentation
ATD's Documentation feature gives your team a structured place to write, store, and discover knowledge — from onboarding guides and architecture decisions to runbooks and data dictionaries. Markdown-native, diagram-friendly, and fully searchable.
Enterprise-Grade Infrastructure
The platform capabilities that let your team work together confidently.
Multi-Tenant
Fully isolated data per organisation. Users can belong to multiple orgs and switch seamlessly.
Two-Layer RBAC
Platform roles (admin · editor · viewer) plus org roles (owner · admin · member).
Change History
Complete audit log scoped per org and asset. Every change is timestamped and attributed.
Tagging
Apply per-org tags across all asset types for fast discovery and filtering.
Invitation Workflow
Invite team members by email. Magic code (OTP) authentication also supported.
Dark / Light Mode
Full theme picker with dark and light mode — persisted per session per user.
Data Governance
Flag PII fields, apply sensitivity classifications (Public through Sensitive Cultural), and track data ownership across every asset in the catalog.
Shareable Dictionaries
Generate a tokenised read-only link to any data dictionary. No login required. Revoke access instantly when it's no longer needed.
See every feature in your own environment
Start a free 14-day trial and bring your own data catalog to life.
Start Free Trial